SGI of TSX Trend Analysis
LONG TERM: (See the attached 3-year weekly logarithmic chart)
SGI formed a destructive double top and fell down in a long-term downtrend
(orange) in two years from 6.50 to the 0.15-bottom support (gray). Total
loss in stock price was 97.69%. There were important supports at 1.90
(green) and 1.00 (blue), but they were both broken down and turned into
resistance. However, below 1.00, SGI formed a huge ascending triangle (red)
and then broke up the long-term downtrend (orange). First the
1.00-resistance was broken up and then SGI entered an up-trend channel
(pink). However in one year SGI rose from the 0.15-bottom to 2.60 (+16 times
the bottom price). Obviously, it is overbought but still we think that the
bull market is not over yet. The consolidation of the last three months is a
bullish pattern called rectangular consolidation and as a result, the
1.90-support (green) is successfully tested as a support. The long-term
outlook is still bullish.
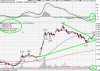
SHORT TERM: (See the attached 6-month daily logarithmic chart)
On the daily chart we can see the rectangular consolidation (red) clearly.
The next step is the testing and breaking up of the 2.60-resistance (red).
If SGI succeeds to break up this resistance the target will rise to
(2.60-1.85=0.75; 2.60+0.75=3.35). The short-term outlook is also bullish.
Americanbulls.com posted a SELL signal 6 days ago. If you are holding this
stock we advise you to keep it unless the rectangle (red) is broken down. If
you do not have this stock and are interested in it, we advise you to add
this stock in your portfolio as soon as the 2.60-resistance is broken up
convincingly. SGI is technically overbought but it still has a bullish
outlook for the long term and the short term.
A small note: Please, do not forget that this report is based on technical
analysis only and here fundamental data (profits, balance sheets and so on)
are not examined. Penny stocks and stocks that lost more than 90% of their
value always carry fundamental risks. So, be careful!