دورة المؤشرنت للتحليل الفني
50 دينار كويتي

أنت تستخدم أحد المتصفحات القديمة. قد لا يتم عرض هذا الموقع أو المواقع الأخرى بشكل صحيح.
يجب عليك ترقية متصفحك أو استخدام أحد المتصفحات البديلة.
يجب عليك ترقية متصفحك أو استخدام أحد المتصفحات البديلة.
look
- بادئ الموضوع أبو هشام
- تاريخ البدء
ابوراشد
عضو نشط
- التسجيل
- 20 سبتمبر 2003
- المشاركات
- 1,300
اخوى ابو هشام السهم هدا انا متابعه من 20 يوم يمكن ماوصل الى 2.15
الغريب انه ماعليه اخبار من زمان يمكن الارتفاع هدا ينبا بخبر قادم
http://indexsignal.com/vb/showthrea...%E3+%C7%DA%D8%EC+%C7%D4%C7%D1%C9+%D4%D1%C7%C1
الغريب انه ماعليه اخبار من زمان يمكن الارتفاع هدا ينبا بخبر قادم
http://indexsignal.com/vb/showthrea...%E3+%C7%DA%D8%EC+%C7%D4%C7%D1%C9+%D4%D1%C7%C1
أبو هشام
عضو
- التسجيل
- 29 أكتوبر 2003
- المشاركات
- 443
نعم قد يكون أخضر إلى نقطة المقاومة 2.64 بس لا تنسون أن اليوم اخر يوم وبعض المستثمرين يفضلون أخذ أرباحهم كاشالرسالة الأصلية كتبت بواسطة ابوراشد
ادا طاف 2.32
بشراسه لايطوفكم ترى راح يصير دربة اخضر
العميد
عضو نشط
الهدف المتوقع 3$ بإذن الله
خلال فتره من اسبوع الى شهر
وفق الله الجميع
خلال فتره من اسبوع الى شهر
وفق الله الجميع
ابوراشد
عضو نشط
- التسجيل
- 20 سبتمبر 2003
- المشاركات
- 1,300
شوفو شقايلين عنه فى موقع النازداك
http://www.nasdaq.com/earnings/anal...ype=&pathname=&page=analystinfo&selected=LOOK
http://www.nasdaq.com/earnings/anal...ype=&pathname=&page=analystinfo&selected=LOOK
ابوراشد
عضو نشط
- التسجيل
- 20 سبتمبر 2003
- المشاركات
- 1,300
LONG TERM: (See the attached 3-year weekly logarithmic chart)
At the first glance we see a huge ascending triangle with a bear trap (red),
which is a very bullish bottom pattern. The bear trap is in the form a
double bottom (blue). If LOOK breaks up the 2.32-neckline (blue) of the
double bottom and returns back into the ascending triangle (red), most
probably it will break up the upper resistance of the ascending triangle at
4.13 (red). This is the bullish scenario, which is more likely. However, if
LOOK cannot enter back into the ascending triangle and bounces back from the
lower trend line of the ascending triangle (red) a third time time, then the
picture gets very ugly. In this case the supports are at 0.76 (green) and at
0.31 (gray). Next week will be a critical week for LOOK.
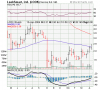
SHORT TERM: (See the attached 6-month daily logarithmic chart)
On the daily chart we can see the double bottom (blue) more clearly. The
pattern may be interpreted as an ascending triangle too when considered with
the line of rising dips (orange). It is also noticeable that both legs were
in the shape of smaller double bottoms (purple, pink). The neckline of the
latter at 2.16 (pink) is already broken up. The next step will be the
testing and breaking up of the 2.32-neckline (blue). If LOOK succeeds to
break up this neckline the target of the double bottom will be
(2.32-1.27=1.05; 2.32+1.05=3.37).
Americanbulls.com posted a fresh SELL signal. If you are holding this stock
we advise you to keep it unless the 2.16-neckline support (pink) is broken
down. If you do not have this stock and are interested in it, we advise you
to add this stock in your portfolio as soon as the 2.32-neckline resistance
is broken up.
===================================
At the first glance we see a huge ascending triangle with a bear trap (red),
which is a very bullish bottom pattern. The bear trap is in the form a
double bottom (blue). If LOOK breaks up the 2.32-neckline (blue) of the
double bottom and returns back into the ascending triangle (red), most
probably it will break up the upper resistance of the ascending triangle at
4.13 (red). This is the bullish scenario, which is more likely. However, if
LOOK cannot enter back into the ascending triangle and bounces back from the
lower trend line of the ascending triangle (red) a third time time, then the
picture gets very ugly. In this case the supports are at 0.76 (green) and at
0.31 (gray). Next week will be a critical week for LOOK.
SHORT TERM: (See the attached 6-month daily logarithmic chart)
On the daily chart we can see the double bottom (blue) more clearly. The
pattern may be interpreted as an ascending triangle too when considered with
the line of rising dips (orange). It is also noticeable that both legs were
in the shape of smaller double bottoms (purple, pink). The neckline of the
latter at 2.16 (pink) is already broken up. The next step will be the
testing and breaking up of the 2.32-neckline (blue). If LOOK succeeds to
break up this neckline the target of the double bottom will be
(2.32-1.27=1.05; 2.32+1.05=3.37).
Americanbulls.com posted a fresh SELL signal. If you are holding this stock
we advise you to keep it unless the 2.16-neckline support (pink) is broken
down. If you do not have this stock and are interested in it, we advise you
to add this stock in your portfolio as soon as the 2.32-neckline resistance
is broken up.
===================================
الملفات المرفقه:
ابوراشد
عضو نشط
- التسجيل
- 20 سبتمبر 2003
- المشاركات
- 1,300
LONG TERM: (See the attached 3-year weekly logarithmic chart)
At the first glance we see a huge ascending triangle with a bear trap (red),
which is a very bullish bottom pattern. The bear trap is in the form a
double bottom (blue). If LOOK breaks up the 2.32-neckline (blue) of the
double bottom and returns back into the ascending triangle (red), most
probably it will break up the upper resistance of the ascending triangle at
4.13 (red). This is the bullish scenario, which is more likely. However, if
LOOK cannot enter back into the ascending triangle and bounces back from the
lower trend line of the ascending triangle (red) a third time time, then the
picture gets very ugly. In this case the supports are at 0.76 (green) and at
0.31 (gray). Next week will be a critical week for LOOK.
SHORT TERM: (See the attached 6-month daily logarithmic chart)
On the daily chart we can see the double bottom (blue) more clearly. The
pattern may be interpreted as an ascending triangle too when considered with
the line of rising dips (orange). It is also noticeable that both legs were
in the shape of smaller double bottoms (purple, pink). The neckline of the
latter at 2.16 (pink) is already broken up. The next step will be the
testing and breaking up of the 2.32-neckline (blue). If LOOK succeeds to
break up this neckline the target of the double bottom will be
(2.32-1.27=1.05; 2.32+1.05=3.37).
Americanbulls.com posted a fresh SELL signal. If you are holding this stock
we advise you to keep it unless the 2.16-neckline support (pink) is broken
down. If you do not have this stock and are interested in it, we advise you
to add this stock in your portfolio as soon as the 2.32-neckline resistance
is broken up.
الملفات المرفقه:
أبو هشام
عضو
- التسجيل
- 29 أكتوبر 2003
- المشاركات
- 443
هلا بو راشد ..
من اللي يزعل على أنشط عضو ... يا أخي أنت أخجلت كل الأعضاء بكرمك و طيبتك واللي يزعل عليك "يصك برأسه الجدار " بس الحقيقة أني ما فتحت الانترنت قلت ارتاح شوي من قلق هالأسهم ونجلس شوي مع أم هشام وهشام ...
صراحة السهم ممتاز ومافيه كلام وأنا شخصياً بسوي أحد شيئين
1- أباتابعه الأسبوع القادم أذا نزل إلى أقل من 1.90 أبأشتري لأنه مصيره بيرتفع سريعا والعلم بيد الله
2- أيضاً اذا طاف 2.35 بفوليوم قوي أبشتري ان شاء الله وأبيع بسرعة أتوقع يمكن يسوي مثل artx .. أمس أنا شريت artx ب 3.07 وبعت ب 3.25 في حوالي 15 دقيقة ..
أخيرا تقبل تحياتي والسلام ..
أبو هشام
عضو
- التسجيل
- 29 أكتوبر 2003
- المشاركات
- 443
الرسالة الأصلية كتبت بواسطة ابو سعود
عجزت أعرف سبب ارتفاع سعر السهم .. وبما إني شاريه ب 1.7 قلت أبيعه وأخذ ربحي قبل إجازة الثلاث أيام ..
وإذا رجع لتحت الدولارين .. أرجع أشتريه ان شاء الله ..
سبب الارتفاع والله أعلم التأثر بأخبار الياهو اللي طلعت ممتازه وأحسن من المتوقع بكثير .. ألف مبروك الربح والله يرزقك ويرزق كل مسلم .. بالتوفيق ..
ابوراشد
عضو نشط
- التسجيل
- 20 سبتمبر 2003
- المشاركات
- 1,300
شباب اليوم نازل عليها خبر
http://biz.yahoo.com/prnews/040416/sff016_1.html
وفى المسج بورد يتكلمون عن شركة الامزون واجد هل لووك لها علاقة بالامازون
http://biz.yahoo.com/prnews/040416/sff016_1.html
وفى المسج بورد يتكلمون عن شركة الامزون واجد هل لووك لها علاقة بالامازون
ابوراشد
الخبر الي نازل عليها اليوم هو أعلان موعد أرباح الربع الأول والى راح يكون 29/4/2004 .
السهم موصين عليه موقع عرض وطلب بسعر شراء 1.65 والبيع على 2.65 .
السهم وصل سعر الشراء 1.65 قبل 3 أسابيع على ما أظن . وهو متجه ل 2.65 والمتوقع أن يصل الى 3.00 لتسكير القاب .
الخبر الي نازل عليها اليوم هو أعلان موعد أرباح الربع الأول والى راح يكون 29/4/2004 .
السهم موصين عليه موقع عرض وطلب بسعر شراء 1.65 والبيع على 2.65 .
السهم وصل سعر الشراء 1.65 قبل 3 أسابيع على ما أظن . وهو متجه ل 2.65 والمتوقع أن يصل الى 3.00 لتسكير القاب .
الملفات المرفقه:
دورة المؤشرنت للتحليل الفني
50 دينار كويتي