إتجاه السوق اليوم الجمعه

المؤشر

المشرف العام
طاقم الإدارة
التسجيل
30 أغسطس 2001
المشاركات
6,732
الإقامة
الكويت
سيركز السوق على أسعار النفط الأمريكي التي لاتزال قريبه من أعلى مستوى وصلت له أمس 54.76 وأيضاً على العديد من التقارير الإقتصاديه التي ستصدر اليوم ومن أهمها مبيعات التجزئه و أسعار المنتجين و مشاعر المستهلكين

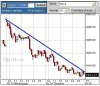
على شارت 10 دقائق يوجد ترندلاين نازل ويشير إلى 1905 تقريباً وسيعمل كمقاومه لخفض الناسداك حتى مستوى 1890 تقريباً أما إذا إستطاع الناسداك تجاوز 1905 سيكون الهدف 1925 تقريباً
 

الملفات المرفقه:

  • nasd10.JPG
    nasd10.JPG
    الحجم: 31.6 KB   المشاهدات: 203

SAIF1743

عضو نشط
التسجيل
18 يوليو 2004
المشاركات
1,279
الإقامة
safwa
جزاك الله خير ابو علي
 

الملفات المرفقه:

  • NAS1.PNG
    NAS1.PNG
    الحجم: 19.5 KB   المشاهدات: 196

SAIF1743

عضو نشط
التسجيل
18 يوليو 2004
المشاركات
1,279
الإقامة
safwa
وهذا شارت يوم الأربعاء اللي فات
 

الملفات المرفقه:

  • NAS3.PNG
    NAS3.PNG
    الحجم: 20.4 KB   المشاهدات: 183

الشعثاني

عضو مميز
التسجيل
20 مارس 2003
المشاركات
2,302
الإقامة
** بلاد الورد **


After Market Report

Market Outlook


Revisiting the ongoing saga of the bulls and the bears we wish to remind everyone of recent events and their implications on the outlook of the market over the next couple of months. As you may recall during the month of September a great deal of institutional accumulation was taking place in the equities market. Excitement over this accumulation ensued and the S&P actually broke above its trading range early this month, while the Nasdaq fully recovered from its failed downside breakdown occurring in July

The bulls at the beginning of the month appeared to have the bears on the ropes and we all anticipated the final knock out punch that would call the match in favor of the bulls. But alas, bears had a reprieve as the knockout punch never arrived and indices have spent the bulk of October retracing part of the recent bullish progress from September

This is what happened, but now we would like to put some
perspective on it and attempt to determine where we go next

The pullback from early October highs may have accomplished a partial goal by the bears to get the indices back down, but it did not erase progress made by recent accumulation taking place in the broader market and in particular small cap stocks. Understand that bears were selling into the rally in September. When the S&P broke out in October, bears found their positions in a lot of trouble. Since this time they have been fighting tooth and nail to pull the indices back down so that they could cover. For example, those making a bearish bet on the broader market were selling QQQ 35 calls. In order for call sellers to maximize their profits, the QQQ shares needed to trade at 35 by last Friday’s options expiration day. The fact that they
couldn’t get it there (QQQ closed at $35.63) has extremely bullish implications

What we want everyone to see here is this: Institutional money accumulated at heavy levels August, and in particular September. This projects that they are betting on a continuation of the bull market out of the 6 month trading range we are now in. Bears were caught unaware and found themselves on the wrong side of the money. Expending their resources over the past two weeks to get shares back down so that they could cover, they have fought with a valiant effort. This effort was NOT complimented by institutional selling and was in fact done against the natural direction of the current market

What this means is that there is pressure building up with each selling effort. It’s like a beach ball that is being forcibly submerged below the water. Once the pressure is released the ball will bounce quickly up
The bottom line is that we may see this effort by the bears continue a bit more this week, but it is likely that they will capitulate near term. Once they do, they will inevitably become bullish themselves further strengthening the bullish push to the upside. If we get a sharp down move this week, consider it a buying opportunity as bears are likely to look for such a move to cover into

Whatever your style, we seem to be at the beginning stages of a solid market that may very well move higher in the upcoming months. The NASDAQ has been unable to hold its 200-day moving average on the first attempt, but moves above major resistance can take as many as three tries before reaching success. If you have access to a NASDAQ chart with a 200-day moving average, you will notice that it took several tries before dropping below this area of support between April 20th and July 6th of 2004. I believe we are currently seeing the opposite as the initial run above it has been made and the time we actually hold above the 200-day may be one or two more tries away

 
أعلى