Day_trading
موقوف
The Technical Take Print version
Updated: 27-Dec-04 09:20 ET
Seasonals Remain Positive
An early run last Thursday and then quiet action into the close. The morning push resulted in new 52-wk highs for small- and mid-cap averages along with the Dow and S&P 500 but the Nasdaq Comp fell just shy of its Mid-Dec high. As expected, volume tailed off as last week progressed and will remain on the light side during this week's action. It's good to be back (I think) but I am a bit worn out from putting together all the toys.
Market Averages
Although I will have to get back in the swing of things, the market typically has no trouble performing well at this time of year. We had strong momentum during November, bullish seasonal factors (January Effect starts Mid-Dec) and now we enter the "Santa Claus Rally" zone. According to the Stock Trader's Almanac the S&P 500 has tacked on an average of 1.5% during the last five trading days of the year and the first two in January.
While most of the averages were able to extend the breakout of their early Dec trading ranges, the Nasdaq Comp has chopped within an easily defined area. Despite the lack of follow through interest, however, the index has remained well positioned as it has held above a short term trendline (off Mid-Nov and early Dec lows) as well as its 20 day exp avg. Resistances beyond the Dec/52-wk high of 2171 are at 2179/2181 and 2196/2200 which mark weekly congestion zones. The 2155/2150 area (20 exp and 50 simple/exp averages -hourly-) is the first zone of support.

The S&P 500 did form a bit of a tail last Thursday but this is not much for the bears to hang their hat on given the time of year and the pre-market readings are pointing to a firmer start to the week. The index is working on a resistance zone that was highlighted a number of weeks ago between 1212 and 1215. A penetration would initially target the 1219/1220 area. Supports are at 1207 (Mid-Dec high) and 1204/1203 (congestion and short term trendline).

If you want to be notified when the Support And Resistance Table and then the full version of The Technical Take commentary are updated, please sign up for our Page Alert e-mail. That feature can be found at the lower left-hand corner of the main index page under the category of e-mail services.
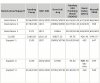
Support and Resistance Table for Monday Dec 27
Support and Resistance Table for Monday Dec 27