إتجاه السوق اليوم الأثنين

المؤشر

المشرف العام
طاقم الإدارة
التسجيل
30 أغسطس 2001
المشاركات
6,732
الإقامة
الكويت
أعلنت المملكه العربيه السعوديه عن نيتها بزيادة إنتاجها النفطي بنسبة 28% في بداية الشهر القادم مما سيعطي السوق اليوم دفعه قويه عند الإفتتاح

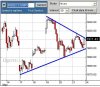
على شارت 30 دقيقه الناسداك محصور بين ترندلاين علوي يشير إلى 1911 وسيعمل كمقاومه وترندلاين سفلي يشير إلى 1900 وسيعمل كدعم وتجاوز الناسداك أحدهما سيحدد الإتجاه اليوم بحيث إذا تجاوز الناسداك 1911 سيكون الإتجاه إلى 1935 أما إذا كسر الناسداك 1900 سيكون الإتجاه إلى 1885
 

الملفات المرفقه:

  • nasd30.JPG
    nasd30.JPG
    الحجم: 31.4 KB   المشاهدات: 278

بو محمد

موقوف
التسجيل
16 يناير 2004
المشاركات
355
الإقامة
KUWAIT
الله يعطيك العافية يــا بــوعلى

وجــــزاك الله كل خــــيـــــر ........
 

سلوم السلوم

عضو نشط
التسجيل
3 نوفمبر 2003
المشاركات
176
انشاء الله السوق اليوم اخضر عشبي

اللهم ارزقني وارزقي اخواني المسلمين
 

undercover

عضو نشط
التسجيل
23 يوليو 2003
المشاركات
484
للتذكير :

منظمة أوبك أعلنت أمس أنها ستؤجل النظر في اقتراح السعودية زيادة الانتاج
 

الدانة

عضو نشط
التسجيل
25 أكتوبر 2003
المشاركات
655
الإقامة
دبي
مؤشرات السوق الآسيوية و الأوروبية مرتفعة اليوم ... ان شاء الله يكون ذلك فال خير على السوق الأمريكي ...
 

الشعثاني

عضو مميز
التسجيل
20 مارس 2003
المشاركات
2,302
الإقامة
** بلاد الورد **

After Market Report


Another day, same old song and dance. Currently, the majority of market and sector indices are consolidating in the area of their 200-day moving averages (200-MA). It is not unusual for prices to stall and/or reverse at the 200-MA, but it is unusual for prices to stay there for as long as they currently have. The S&P 500 is also at its 200-MA and has not been able to move far from it since reaching it eleven trading sessions ago

When prices reach the 200-MA, they will typically move from it within two or three days; this has not been the case this time. The longer prices take to change direction after reaching a technical focal point (the 200-MA), the greater is the potential for traders who use it as a reference to lose confidence in it

Taking a look at the - Dow and S&P charts you can see that there has been a series of run ups in the morning that have sold off from the top each day. This is looking more and more like distribution. Further, the levels right now are up against their downtrend marks, indicating that a larger move is in store. The indication is that the move will be to the downside. Again, unless and until the S&P breaks its 200-day average, anything could happen here. So, for now, the best thing to do is keep playing the micro moves, while betting against trend development until a follow through on the downtrend (likely) occurs or a breakout to an uptrend starts - unlikely​
 
أعلى