أسهم على بابا والاربعين حرامي

m&m

عضو محترف
التسجيل
27 أغسطس 2002
المشاركات
2,086
الإقامة
السعوديه
8/ديسمبر(سهم واحد) وله تقرير

1) vert
الشراء بين 1.50 الى2
الخطوره 1.30
البيع3 الى 3.50

السهم له تقرير مفصل وجميل ولكن اختصر في كلمتين
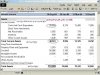
24 نوفمبر تمت مبايعة لاسهمها بسعر 1.10 الشركة نمت بشكل افضل من السنه المالية الماضيه وارباحها نمت بشكل جيد 3 مرات عن السنه الماضيه
والعملا ايضا 600%
الشراء واضح جدا من قبل المدراء والانسايدر السعر المتوقع والذي تصل له ان شاء الله خلال اسابيع قليلة 3 الى 3.5
الشركة تقدم حلول ادارية لكثير من الشركات 2000 شركة
يصف ان سعر السهم اصبح في السترونق هان اليد القويه وليس في اليد المتردده
وهذا تقريرvert

Stocks to watch:

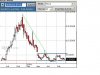
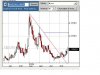
VERT - it's hard to ignore the bullish near term technical signals now being exhibited by Verticalnet Inc (VERT). Shares of Verticalnet rose nearly 36% in an overwhelmingly negative market environment to close near their high of the session at $1.74 on very heavy trading volume (nearly 7 million shares traded hands versus the stock's 90 day average daily volume of just over 226k shares per day). No news out that we can see to affect such a change, so we have to assume it was purely technical in nature. Still, it was a very healthy technical development that from a chart price pattern perspective clearly signaled an upside breakout for a stock that was recovering from a 52 week low (set back in mid August) around the $1.00 area and one that was well off of its 52 week high it reached in late January of this year around the $3.70 area. If buying interest in this stock continues to mount, a return to the $3.00 to $3.50 area is quite possible over the next few weeks.

Verticalnet, Inc. is a provider of supply management solutions to Global 2000 companies. The Company provides supply management software, services and domain expertise in areas that include spend analysis, advanced esourcing, eprocurement, contract management and supplier scorecards. Its solutions are bundled into four process steps of supply management: Supply Strategy, Supply Selection, Supply Execution and Supply Performance. In addition, Verticalnet's professional services and consulting groups provide customers with project management, architecture and design, custom development services and training.

As most of you who've been with A-Z for some time may have figured out by now, we love to see major divergences in our technical analysis of a stock - and boy do we have a dilly with our technical assessment of VERT. Money flow into this stock is now at a nearly four year high. In fact, the last time accumulation in this stock was this high shares of Verticalnet were trading between $50 and $60 per share. This year alone as the stock continued to fall from its 52 week perch in the $3.70 area to near the $1.00 area over the first eight months of the year, money flow remained constant (after a limited drop from late January to early April after which it slowly began stairstepping higher once again). This suggests that the stock was moving from weak hands to strong hands. Yesterday's close of $1.74 put the stock's price well above the high end of our set Bollinger Band parameters, suggesting further upside movement over the next few sessions is probable.

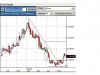
The near term relative strength indicators, which had remained steady around mid range for the past couple of months, have begun to trend sharply higher and are not far from reaching overbought status - the only cautionary signal we have at this point and one that suggests a 'buy on the dips' strategy make work well here. Finally, the shorter term stochastics are rising very rapidly from extremely oversold levels, but have yet to reach mid range with plenty of upside before threatening an overbought condition. Remember though, the stochastics can move very, very rapidly - so a decent move up over the next couple of sessions could put these indicators well into overbought territory very soon. Still, we think this one's worth consideration, so we're making it our first spec play of the day (below) this morning.

Spec Plays:

VERT - Buy Range - $1.50 to $2.00 (risk to a break below the $1.30 area). Sell Range - $3.00 to $3.50. Previous close - $1.74.
 

m&m

عضو محترف
التسجيل
27 أغسطس 2002
المشاركات
2,086
الإقامة
السعوديه
اخي الكريمgreat-name
شكرا لك وموضوع اخي المطلق كنتمستعجل لعدم فهمي له اقدم اسفي
وجزاه كل خير

وجزاك الله كذلك لحرصك على متابعه الموضوع والاسهم التي تفضلت وذكرتها ومعلوماتك عنها
jmar له تقرير وسوف انشره قريبا وكما ذكرت هي من السمول كاب الان والله أعلم وش بيصير لها
محلل معروف على ما اعتقد وصى على evol عندما كانت على 15 او 19$ ما اتذكر ان شاء الله تكون صحيحه معلوماتي وهو tobinsmith مع ملاحظة ان p/e ارباحها القادمة لا يتناسيب مع سعرها الأن (3.69 دولارفاهو عالي جدا 61
وملاحظة الاسهم قليلة جدا
جدا جدا
اتمنى تتابع معي وبعد شهر نشوف الاسهم اين ذهبت واستقر بها الحال

تحياتي لك وللجميع
 

great-name

عضو نشط
التسجيل
17 مارس 2004
المشاركات
249
الإقامة
kuwait
عزيزي m&m
راح اتابع ان شاء الله معاك ومع الاخوان المهتمين بموضوع علي بابا

ان شاء الله ان تصيب الاسهم الاهداف الموضوعه لها

والله يوفقك ويفقنا معاك سبحانه

طلب بسيط بخصوص Evol اذا عندك اي معلومات عن السهم لاني شاري واشوفه ينزل هل هو جني ارباح ام شنو افدنا فيه والله الموفق

الله يجزاك خير

دمتم سالمين
 

m&m

عضو محترف
التسجيل
27 أغسطس 2002
المشاركات
2,086
الإقامة
السعوديه
Stocks to watch: خاص بسهم jmarوهو ليس عليه تغطيه من اي محلل لا داون ولا قريد وهو نانو تكنولوجي

JMAR - here's one of our spec plays from our last report that managed to gain over 8% on Friday to close near its high of the session at $1.82 on heavier than normal trading volume after hitting an intraday high of $1.87. Shares of Jmar Technologies (JMAR) - a company engaged in the development of laser based imaging equipment for the nanotechnology sector - now look poised for a very decent upside breakout. If short term buying interest can be maintained, a return to the $3.00 to $3.50 area could be acheived in relatively short order with some limited resistance coming in around the $2.00 area. The main near term technical indicators are all lined up signaling continued upside movement is quite possible over the next few sessions so we're raising our forecasted buy and sell ranges a bit from Friday's numbers in anticipation of this one picking up some more upside steam.

JMAR Technologies, Inc. is engaged in the development of laser-based equipment for imaging, analysis and fabrication at the nano-scale. The Company is leveraging over a decade of laser and photonics research to develop a diverse portfolio of products with commercial applications in rapidly growing industries, while continuing to provide support for the United States Government's Defense Microelectronics Activity (DMEA) semiconductor fabrication facility. JMAR is targeting the nanotech, bioscience and semiconductor industries with its Britelight laser; Compact X-ray Light Source; X-ray Microscope (for three-dimensional visualization of single cells and polymers), and its X-ray Nano Probe, enabling interaction, analysis and modification at the nano-scale. JMAR also maintains strategic alliances for the development of BioSentry and READ, biological and chemical sensors for homeland security, environmental and utility infrastructure industries.

As previously stated, the near term technical picture for JMAR looks promising. Friday's close of $1.82 was the second consecutive close noticably above the high end our set Bollinger Band parameters, suggesting continued upside movement over the next few sessions is probable. Additionally, money flow into the stock has now begun trending higher after months of flatlining at significantly higher levels following a breif period of distribution from early April to mid May of this year and is now nearing multi - year highs. That sell off from April to May though was precipitated by a huge buying spree from institutional investors in early January of this year and again in late March / early April of this year. In fact, even though the stock is trading about where it was last December (roughly in the $1.50 to $2.00 area), institutional and / or astute investors have poured money into this stock over the past year and it is well off its January highs in the $4.75 area.

Furthermore, the near term relative strength indicators have turned higher once again after slightly trending lower over the past five to six weeks. Still, they're just about mid range with plenty of upside left in them before signaling an overbought condition. Finally, the shorter term stochastics have been rising sharply from extremely oversold territory since just before the Thanksgiving holiday week began. They are approaching short term overbought, which may make a 'buy on the dips' strategy a good option for this one. In other words, any short term weakness over the next few sessions could be a buying opportunity, folks. We think this one's worth consideration as a short term play, but even may qualify as a longer term Platinum Pick based on the accumulation over the past year by the smart money and the fact that it is connected to one of the burgeoning high tech industries of the future - the nanotechnology sector.

Spec Plays:

JMAR - Buy Range - $1.50 to $2.00 (risk to a break below the $1.35 area). Sell Range - $3.00 to $3.50. Previous close - $1.82.


اخي great-name الله يوفقكم يارب فيه ان شاء الله
بعض الاسهم تحتاج شارت ودراسة فنية للدخول الافضل وانا لا ادخل للمنتدى والسوق الا 2 ساعة او اقل ما اقدر افيدكم هل جني ارباحه او ضغط على السهم

السهم لم يذكر فيه اي تقرير ,, بالتوفيق
وشكرا لك مره ثانية للمتابعه
 

m&m

عضو محترف
التسجيل
27 أغسطس 2002
المشاركات
2,086
الإقامة
السعوديه
9 ديسمبر

Stocks to watch:
هذا التقرير للسهم sflk وهو سهم ذكر في كذا تقرير لان بعض الاسهم يعيدون ذكرها ومتابعتها
SFLK - we last highlighted SAFLINK Corp (SFLK) back in our November 18th report, after the stock had closed the previous session at $2.59. Shares of SFLK subsequently rose to a near term peak just above the $3.00 level, but have since settled back into what appears to be a bit of a range roughly between the $2.60 and $3.00 area, closing yesterday up a tad at $2.77 on lighter than normal volume. The stock is a few cents lower this morning as well, but the major technical indicators that led us to call for an eventually significant rise in this stock's share price remain intact. This stock is one that should be considered using a 'buy on the dips' strategy. Consequently, you may want to take another look at Saflink if you didn't take a hard look at it the last time we mentioned it. As a result, here's an updated version of our original highlight of the stock:

Here's a little software security solutions provider whose near term technicals and price chart pattern appear to be lining up for a very decent move higher. We like the software security sector and believe it is a burgeoning industry that may grow worldwide by leaps and bounds over the next few years (which makes Saflink a candidate as a longer term play as well). Recently, the Company entered into a subcontractor agreement with BearingPoint to provide biometric expertise and consulting services to the Transportation Security Administration (TSA), a part of the Department of Homeland Security. The technical outlook for this stock is very positive and if upside momentum emerges over the near term, we think it may be primed to spike back to the $4.25 to $4.75 area in the not too distant future. There are currently three analysts covering the stock with an aggregate one year price target in the $8.00 area. Not saying that's going to happen soon, or even at all, but a rise to half that price ($4.00) shouldn't be out of the question at all over the near term.

SAFLINK Corporation offers software solutions that protect intellectual property, secure information assets, control access to physical facilities and eliminate passwords. The Company's Secure Authentication Framework (SAF) software provides identity assurance management, allowing administrators to verify the identity of users and control their access to computer networks, physical facilities, applications, event tracking systems and time and attendance systems. SAFLINK develops application software, and resells hardware and device control software from manufacturers of biometric hardware devices. Its products may be used to protect business and personal assets and to replace passwords, keys and personal identification numbers (PINs). SAFLINK's products can be divided into two groups: computer access products and physical access products.

The glaring divergence from a technical standpoint for Saflink is the money flow picture, which has continued to rise dramatically since June of last year - a time frame when the stock peaked above the $7.00 per share level. A sixteen month price chart of the stock's activity clearly shows that although the stock has fallen precipitously from well above the $6.00 level back in late July 03 down to current levels between the $2.50 and $3.00 area, during the same period massive accumulation has occurred. This divergence shows the stock trading from weak hands into strong hands. After trending noticeably higher from mid to late November, the near term relative strength indicators for SFLK have leveled off a bit just above mid range and still have plenty of upside in them before threatening an overbought situation.

The stock's recent sideways price pattern has moved it back into the middle of our set Bollinger Band parameters, so a break above the high end of those bands could signal the break out we're looking for and may cause a very short term burst to the upside since a quick look at this year's price chart suggests the stock seems prone to such action. Finally, Saflink's shorter term stochastics have corrected from an overbought situation that occurred late last month, just days after our last highlight of the stock. They've hit mid range and could be poised to turn higher once again. We think this one's definitely worth watching, so we're making it our first spec play of the day (below) this morning.

Spec Plays:

SFLK - Buy Range - $2.25 to $2.75 (risk to a break below the $1.98 area). Sell Range - $4.25 to $4.75. Previous close - $2.77.
اما الاسهم الثانية كلها اجتازة الفلتره وللدراسة والمتابعه
SCON - Buy Range - $1.00 to $1.25 (risk to a break below the $0.80 area). Sell Range - $2.00 to $2.50. Previous close - $1.17.
بداية السنه 6$ والان 1.19$
AGRA - Buy Range - $1.50 to $1.75 (risk to a break below the $1.20 area). Sell Range - $2.50 to $3.00. Previous close - $1.52.

XYBR - Buy Range - $1.13 to $1.38 (risk to a break below the $0.98 area). Sell Range - $2.00 to $2.25. Previous close - $1.32.

بالتوفيق

للمتابعه
 

m&m

عضو محترف
التسجيل
27 أغسطس 2002
المشاركات
2,086
الإقامة
السعوديه
عن سهم sflk
يوضح الارباع الاخيره وخاصة ان الشركة عملت عقد مع سهم be
السهم في قطاع الامني والسكيورتي وارجوا القراءه عته جميل جدا هذا السهم
ملاحظه هذه التقرير فيها اسهم كانت بي 2 دولار والان 11 دولار
وايضا فيها اسهم بالسنتات وارتفعت الى دولارات وعادت من جديد لوضعها السابق
لذا اختياركم للسهم للجيد مسؤلية
بالتوفيق

صفحة sflk
http://finance.yahoo.com/q?s=SFLK
صفحة سهم be للاطلاع
http://finance.yahoo.com/q?s=be
 

الملفات المرفقه:

  • sflk.jpg
    sflk.jpg
    الحجم: 66.3 KB   المشاهدات: 284

m&m

عضو محترف
التسجيل
27 أغسطس 2002
المشاركات
2,086
الإقامة
السعوديه
10/ ديسمبر
Stocks to watch:

FMDAY - we've listed Futuremedia (FMDAY) as a spec play more than once in the past few weeks, but the stock's near term technicals are now too compelling to ignore, so we're highlighting it this morning. The last time we listed FMDAY as a spec play was back in our November 26th report after the stock closed the previous session at $0.90. Since then shares of Futuremedia have risen to a near term high of $1.21 (earlier this week) and backed off again, closing yesterday up nearly 5% at $1.06 on heavier than normal trading volume. Accumulation in the stock (which was already very high) has increased dramatically in the past couple of weeks and if investor bullishness continues, this stock could be ready for a break out that could easily take it back to the $1.75 to $2.00 level with only limited upside chart resistance coming in around the $1.50 area.

Futuremedia Public Limited Company provides e-learning products and services to the corporate and public sector markets. The elements of the products include: courseware production, which constitutes the development and distribution of customer-specific training content and a simulated three-dimensional learning environment; courseware library, which is comprised of the distribution of off-the-shelf standard training courses from third-party content providers; the development and distribution of Internet- or Intranet-based learning management system, Aktivna, including the distribution of development tools and the facilitation of customer hosting services; the provision of e-learning through the Company's Learning For All program, and consulting and other professional services to support the development and the implementation of e-learning solutions and strategies. In March 2004, the new development capability called Experiential Learning Simulation and Assessment (ELSA) was launched.

Money flow into Futuremedia is nearing all time highs and even though the stock has fallen from its 52 week high perch (back in early April of this year) around the $2.18 area down to an August low in the mid sixty cent range before recovering a bit to its current levels, money flow has remained extremely high during these many months. This suggests that astutue investors have been accumulating the stock as ownership has transferred from weak to strong hands. Additionally, the stock's recent break above the $1.00 area has put it well above the high end of our set Bollinger Band parameters, suggesting further upside movement is probable over the short term.

The stock's near term relative strength indicators have just corrected from an overbought condition and now look like they may be ready to turn higher once again - a strong technical positive. Finally, the shorter term stochastics have been rising sharply from oversold levels since late last month, but have yet to make it to an overbought condition. Shares of FMDAY are up slightly again this morning and are hitting the high end of our listed buy range for this report, but if you take a gander, like what you see but aren't quite comfortable getting in on the high end of the range, you may be able to employ a 'buy on the dip' strategy. That's a judgement call you'll have to make, the downside of it is you may miss the move up if that dip doesn't occur!!

Spec Plays:

FMDAY - Buy Range - $0.88 to $1.13 (risk to a break below the $0.80 area). Sell Range - $1.75 to $2.00. Previous close - $1.06.
هذا السهم كتب عنه تقرير
AVNX - Buy Range - $3.25 to $3.75 (risk to a break below the $2.75 area). Sell Range - $5.25 to $5.75. Previous close - $3.54.
لمم ادرسة او اطالع في بيناته
VRA - Buy Range - $0.88 to $1.13 (risk to a break below the $0.80 area). Sell Range - $1.75 to $2.00. Previous close - $1.01.
هذا السهم بيوتكنولجي وخسرني 70% من محفظتي وبعته ولا احبه): ,لم يجتاز الفلتر كا زملاءه
CIEN - Buy Range - $2.50 to $3.00 (risk to a break below the $2.20 area). Sell Range - $4.75 to $5.25. Previous close - $2.88.
هذا السهم تمت توصية عرض وطلب 7.50دولار والبيع 15 دولار


--------------------------------------------------------------------------------
 
التسجيل
14 ديسمبر 2003
المشاركات
6,715
الإقامة
الـريـاض
الله يعطيك العافية

مجهود تشكر علية
الله يجزاك عنا خير
 

m&m

عضو محترف
التسجيل
27 أغسطس 2002
المشاركات
2,086
الإقامة
السعوديه
13 ديسمبر
ذكر تقرير عن سهم غير شرعي فتم اسبعاده

اما الاسهم لهذا اليوم فاهي كا التالي مع ملاحظة بعض الاسهم ذكر من قبل

[VERT: Buy Range - $1.75 to $2.00(risk to a break below the $1.38 area). Sell Range - $3.00 to $3.50. Previous close - $1.75.

PAX - Buy Range - $1.25 to $1.50 (risk to a break below the $1.18 area). Sell Range - $2.25 to $2.50. Previous close - $1.45.

XYBR - Buy Range - $1.25 to $1.50 (risk to a break below the $1.13 area). Sell Range - $2.25 to $2.50. Previous close - $1.35.


وبالتوفيــــــــــــــــــــــإن شاء الله ـــــــــــــــــــــــــــــق

ارجول مراجعة الاسهم السابقه
 

m&m

عضو محترف
التسجيل
27 أغسطس 2002
المشاركات
2,086
الإقامة
السعوديه
14 ديسمبر

تقرير مفصل ان سهم tgal


Stocks to watch:

TGAL - we're liking the semiconductor sector right now and here's a little semiconductor equipment and material manufacturer that may do very well if the semis pick up steam in the next few weeks. The near term technical outlook for Tegal Corp (TGAL) has been improving since mid November and the stock appears poised to break out to the upside. Shares of Tegal rose over 14% yesterday to finish at their highs of the session at $1.79 on heavier than normal trading volume. The stock is trading a few cents lower in early going this morning, but we think that may be just some backing and filling that could be creating a better buying opportunity. The near term price chart shows that a break out and close above the $2.00 area could send this stock back to the $3.00 to $3.50 range with only some limited upside resistance coming in around the $2.50 area.

Tegal Corporation designs, manufactures, markets and services plasma etch and deposition systems that enable the production of integrated circuits (ICs), memory and related microelectronics devices used in personal computers, wireless voice and data telecommunications, contactless transaction devices, radio frequency identification devices, smart cards, data storage and micro-level actuators. The Company's products include 6500 Series Critical Etch, which comes in several models configured to address film types and applications desired by the customers; 900 Series Non-Critical Etch, which was enhanced as non-critical etch systems capable of performing the etch steps required in the production of silicon-based IC devices, and Endeavor Series Critical Deposition Products, which comes in several models configured to address film types and applications desired by the customer. In June 2004, it acquired First Derivative Systems, Inc.

As previously stated, the near term technicals for this stock are looking good. Money flow into the stock has been rising sharply since the middle of last month and is now at its highest level in eight months. The near term relative strength indicators for TGAL have been on a steady trend higher since the beginning of November, but are just above the mid range mark and have some room to move on the upside before threatening an overbought condition. Average daily trading volume has picked up substantially over the past few weeks and the stock's shorter term stochastics are rising sharply from mid range after a brief correction from overbought territory late last month. We think this one's got some upside room to go, so we're making it our first spec play of the day (below) this morning and will be monitoring it carefully over the next several sessions.

Spec Plays:

TGAL - Buy Range - $1.50 to $1.75 (risk to a break below the $1.30 area). Sell Range - $2.50 to $3.00. Previous close - $1.79.


SBYN - Buy Range - $2.75 to $3.25 (risk to a break below the $2.50 area). Sell Range - $4.75 to $5.25. Previous close - $2.50.

IVAN - Buy Range - $2.50 to $2.75 (risk to a break below the $2.13 area). Sell Range - $4.00 to $5.00. Previous close - $2.70.

3 من اربع اسهم مع ملاحظة ان السهم الثاني عليه اخبار جيده
 

great-name

عضو نشط
التسجيل
17 مارس 2004
المشاركات
249
الإقامة
kuwait
أوجه عناية الاخوة أعضاء المنتدى الكرام الى متابعة الاسهم اللي يرطحها اخونا العزيز m&m لما تتضمنه من اسهم ممتازه حسب متابعتي لها واتمنى المشاركه من الجميع في تحليل الاسهم واختيار افضلها كما اتمنى من الاخوه الذين لديهم المام بالتحليل الاساسي ان يعطونا رئيهم في الاسهم ..وهي في رايي وحسب خبرتي المتواضعه في الاسهم تعتبر اسهم سوينق محترمه فعلا ... فيه اسهم جابت نتائج جدا جيده من ضمنهم NENG , LGVN هذين السهمين تابعتهم وبقية الاسهم ان شاء الله تجيب نتائج طيبه على صاحبها الطيب m&m

وتحياتي للجميع
 

m&m

عضو محترف
التسجيل
27 أغسطس 2002
المشاركات
2,086
الإقامة
السعوديه
مشكووور الله يجزاك خير

ان شاء الله ندخل في توصيات الموقع بعد اقتناع

انا ما شريت لحد الان

واضع امر شراء على TGAL كا تجربه وهو سهم قديم لدي 1.74 والان راح 1.93
السهم اعرفه وكل واحد له قناعة في اختياره
الحمدالله وجدت الموقع الذي يرضيني وانتم كذلك لحد الأن ,,,مع عدم دخول في البيوتكنولوجي ابدا ,, وهذ الجهد المتواضع والله المستعان
واضم صوتي لصوتك
http://www.indexsignal.com/vb/showthread.php?t=20907
شكرا
 

great-name

عضو نشط
التسجيل
17 مارس 2004
المشاركات
249
الإقامة
kuwait
الله يوفقك ان شاء الله في Tgal
ممكن استفسار بخصوص البيوتكنولوجي اخوك ما يعرف عنه شي وانت تنصح بعدم الدخول فيه ابدا ... يعني اذا يسمح وقتك تعطينا فكره عن البيوتكنولوجي وشكرا
 

m&m

عضو محترف
التسجيل
27 أغسطس 2002
المشاركات
2,086
الإقامة
السعوديه
أخي great-nameشكرا على متابعتك للموضوع وان شاء الله يوفقنا الله جميعا جزاك الله ولكم بالمثل
...البيو تكنولوجي هي شركات الادوية والبحوث العلمية مثلا شركة تعمل بحوث هامة حتى توافق عليه منظمة الصحة العالميه fda لذا اشوف مخاطره خاصة من وجهة نظري المتواضعه لانها ممكن تطلع فوق بخبر نجاح او تنزل تحت بيوم لفشل
اما البيوتكنولجي اندكس , شركاتها في هذا الرابط كالفابيتكال ومرتبه على هذا الاساس http://biz.yahoo.com/ic/bi.html
http://biz.yahoo.com/ic/biotrx_cl_all.html
 

محامي

عضو نشط
التسجيل
1 أكتوبر 2004
المشاركات
117
الإقامة
الكويت
m&m العزيز الغالي

vsnt سهم ذكرته في هالرابطه هل لازلت متمسك فيه لاني شاري فيه ويهمني رايك
 

m&m

عضو محترف
التسجيل
27 أغسطس 2002
المشاركات
2,086
الإقامة
السعوديه
نعم وكما جاء في التوصيه البيع بعد 20 يوم تزيد او تنقص قليلا

نعيد التوصيه

4-vsnt
شراء .75 الى 1
الخطورة .70 سنت
البيع 1.50 الى1.75 دولار

ولا تنسى اخي الكريم اننا نشتري مع محفظه يعني العب معهم


وهذا هدية للمتابعه بتاريخ 9 نوفمبر

ممكن يسوي شيئ احببت ذكره

stkr نطاق الشراء بين 1.13 الى1.38 البيع من 2 الى 3 الخطورة عند 1دولار السعر اغلاق امس 14 ديسمبر هو 1.47 ارتفاع 26%
معلوماتي المتواضعه هو القيمة الدفتريه .91 skj
الاسهم قليلة جدا راجعوا بيناتها في الياهو عملت اتحاد مع navitor بقيمة 25 مليون
متوقع ارباحها معا 45 مليون الانسابدر يشترون
 

m&m

عضو محترف
التسجيل
27 أغسطس 2002
المشاركات
2,086
الإقامة
السعوديه
محامي قال:
m&m العزيز الغالي

vsnt سهم ذكرته في هالرابطه هل لازلت متمسك فيه لاني شاري فيه ويهمني رايك


ملاحظة الستوب لوز مبين هنا

ايضا ارباحها 15 ديسمبر "هذا اليوم" ولم يحدد هذا اللي شفته في صفحة الياهو قبل او بعد لا اعلم الاسهم قليلة جدل يعني لو جيده بيرتفع بشكل كبير والعكس صحيح

بالتوفيق
كن حذر
 
التسجيل
14 ديسمبر 2003
المشاركات
6,715
الإقامة
الـريـاض
Evol
 

الملفات المرفقه:

  • evol.JPG
    evol.JPG
    الحجم: 28.9 KB   المشاهدات: 222
التسجيل
14 ديسمبر 2003
المشاركات
6,715
الإقامة
الـريـاض
Jmar
 

الملفات المرفقه:

  • jmar.JPG
    jmar.JPG
    الحجم: 30.9 KB   المشاهدات: 255
التسجيل
14 ديسمبر 2003
المشاركات
6,715
الإقامة
الـريـاض
Lgvn
 

الملفات المرفقه:

  • lgvn.JPG
    lgvn.JPG
    الحجم: 31.6 KB   المشاهدات: 222
أعلى