Brlc

متداول اسلامي

عضو مميز
التسجيل
7 أكتوبر 2005
المشاركات
2,099
الإقامة
في الميتاستوك
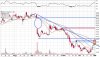
هلا بالحبيب عندك اخر 90 دقيقه
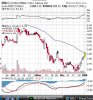
شوف بالله انا عندي شنو اخر 90 يوم

The current environment actually favors BRLC (Olevia) over other TV manufacturers. BRLC has increased prices 3 times in the last 90 days, and has excellent relationships with panel manufacturers to ensure a steady price-protected supply of panels. Additionally, they have numerous consumer report best in class accolades. These are not insignificant awards. They compete with the likes of Sony (SNE) and Samsung.

Rounding BRLC's capitalization to 100 million shares (presently 93,350,000), my calendar year 2008 model would look something like this:

Total revenue: $850,000,000
Royalties (3% of $500,000,000): 15,000,000
Gross profit (15% of $850,000,000): 142,500,000
SG&A: 42,500,000
R&D: 4,200,000 Non-cash (added back): 4,000,000
EBITA: 99,800,000
Operating profit (subtract non-cash): 95,800,000
Interest:18,000,000
Taxes: 29,300,000
EPS: .48

We arrived at a $7.20 target price based on 15 times earnings. This revenue estimate does not include Europe, Latin America, or any other licensing opportunity for the Olevia brand.

The original investment thesis put forth on BRLC was a momentum based revenue model. With hindsight, this model could not finance its growth due to the fact that Chinese receivables were not collectable for 120 days. Shareholders were not willing to live with the negative cash flow, so a model change was inevitable. If there is any question about why BRLC did not factor their receivables, the answer is that they tried and failed. Chinese banks require a 5 year operating history, and $100 million trailing EBITA. Domestic and European banks would only lend against accounts receivable. They would not purchase them. The royalty model was the best alternative
.
 

al7bebe

عضو نشط
التسجيل
24 مارس 2005
المشاركات
10,052

al7bebe

عضو نشط
التسجيل
24 مارس 2005
المشاركات
10,052
المتوقع للسهم

we could easily go up 25 to 30 %

1- SCHOT pays up
2- Earnings/sales estimates
3- European plan
4- New board member (maybe 10 to 15%)
5- Beat estimates
6- Merger news could be anything- 40, 50, 100, 200% or more!

Me- I am taking my chance on the long sode. It only make sense fo management to start rebuilding share holder value on 1/2/2008!!
 

al7bebe

عضو نشط
التسجيل
24 مارس 2005
المشاركات
10,052
كسر 3.10 قول افتتح ياسمم

عقدت السهم 3.10 من كم يوم
 

al7bebe

عضو نشط
التسجيل
24 مارس 2005
المشاركات
10,052
الف مبروك وكسرها وكسر الحاجز النفسي ايضا 3.11 والهاي 3.13

المهم الاسبوع القادم نشوف اسعار حلوة
بااتوفيق اخي متداول بس شوية صبر مع اني ادري الصبر عندك غير ممكن :)
 

متداول اسلامي

عضو مميز
التسجيل
7 أكتوبر 2005
المشاركات
2,099
الإقامة
في الميتاستوك
تصدق عاد يالحبيب
قاعد افكر وايدي تحكني اقول الحمدلله ربح 0.11 نعمه
لكن حبسني حابس:)
وتوني راجع
ان شالله نصبر مو اكثر من اسبوعين
lcav جزاه الله خير قاروه شجعني لما قالي البيع على الموفنج وايدي تحكني والحمدلله طلعت ب20
وان شالله نصبر مع brlc وياك
 

al7bebe

عضو نشط
التسجيل
24 مارس 2005
المشاركات
10,052
ادري فيك مستعجل

تصدق عاد يالحبيب
قاعد افكر وايدي تحكني اقول الحمدلله ربح 0.11 نعمه
لكن حبسني حابس:)
وتوني راجع
ان شالله نصبر مو اكثر من اسبوعين
lcav جزاه الله خير قاروه شجعني لما قالي البيع على الموفنج وايدي تحكني والحمدلله طلعت ب20
وان شالله نصبر مع brlc وياك
--
على العموم انت اكيد ربحان وانت بكيفك بس راح اصبر عليه الاسبوع القادم
كسر 10 هذا هو مرادي
 

متداول اسلامي

عضو مميز
التسجيل
7 أكتوبر 2005
المشاركات
2,099
الإقامة
في الميتاستوك
وان شالله انا وياك باذن الله :)
والله يحقق مرادك
 

al7bebe

عضو نشط
التسجيل
24 مارس 2005
المشاركات
10,052
لاحظ معامل السعر والارباح للشركة

5.94
 

al7bebe

عضو نشط
التسجيل
24 مارس 2005
المشاركات
10,052
للتذكير

الاغلاق اليوم 1-1-2009
3.08
سعر الاغلاق السابق
3.03
الافتتاح
3.05
الهاي اليوم
3.13
--------
بالتوفيق للجميع
 

متداول اسلامي

عضو مميز
التسجيل
7 أكتوبر 2005
المشاركات
2,099
الإقامة
في الميتاستوك
لاحظ معامل السعر والارباح للشركة

ممكن تشرح لي يالحبيب معلوماتي بسيطي ومافهمت
شنو معامل السعر والارباح الرقم هذا عباره عن شنو وشلون طلع وشنو مفاده


الاغلاق اليوم 1-1-2009
3.08
سعر الاغلاق السابق
3.03
الافتتاح
3.05
الهاي اليوم
3.13
--------
بالتوفيق للجميع

يالطيب يالحبيب 2009 ولا8
:)
 

al7bebe

عضو نشط
التسجيل
24 مارس 2005
المشاركات
10,052
اعذرنا حصل خلل فني في التوقيت المحلي

نسبة السعر/الربحية 5.94118
ربحية السهم 0.34

التاريخ/الوقت 31/12/07 5.27 Pm الكميه المتداوله 1,870,250

آخر صفقة 3.08 حركة

نسبة التغيير +1.65% التغيير +0.05

طلب 3.05 عرض 3.07

أفضل كمية طلب شراء 500000 أفضل كمية عرض بيع 200000

إفتتاح 3.05 الإغلاق السابق 3.03

أدنى سعر 2.95 أعلى سعر 3.14

أدنى سعر-سنة 2.4 18/12/2007 أعلى سعر-سنة 11.7 08/01/2007

نسبة السعر/الربحية 5.94118 ربحية السهم 0.34
يوم توزيع الأرباح 01/01/1970 يوم إعلان الأرباح 01/01/1970

الفترة: يوم واحد 5 أيام 3 أشهر 6 أشهر سنة واحدة سنتان 5 سنوات
--
تصدق احسب السنة 2009 ما احب الارقام الفردية وسهمنا سكر متعمد على السنة 2008 ///////3.08 :)
--
لو مكملها يا الطيب يالحبيب يامعود... :)
 

متداول اسلامي

عضو مميز
التسجيل
7 أكتوبر 2005
المشاركات
2,099
الإقامة
في الميتاستوك
شرايكم ياجماعه للمضارب بالبيع على الموفنج افرج ما تتوقعون يكون مقاومه واخذ السهم بسعر اقل من السعر الحالي ؟
ولا الاحتفاظ افضل خاصه انه اخترق الموفنج افرج
مبروك يالحبيب
 

الملفات المرفقه:

  • brlc2.jpg
    brlc2.jpg
    الحجم: 50.3 KB   المشاهدات: 121

متداول اسلامي

عضو مميز
التسجيل
7 أكتوبر 2005
المشاركات
2,099
الإقامة
في الميتاستوك
Day's Range: 3.10 - 3.32
 

al7bebe

عضو نشط
التسجيل
24 مارس 2005
المشاركات
10,052
تم الخروج 3.39

احمدالله على المكسب
 

متداول اسلامي

عضو مميز
التسجيل
7 أكتوبر 2005
المشاركات
2,099
الإقامة
في الميتاستوك
3.34 هذا الهاي يالحبيب ماوصل 3.39

الف مبروك والحمدلله تستاهل كل خير والله يجزاك خير
 

متداول اسلامي

عضو مميز
التسجيل
7 أكتوبر 2005
المشاركات
2,099
الإقامة
في الميتاستوك
الحمدلله خرجنا 3.4
Day's Range: 3.10 - 3.39
الظاهر من التاخير
 

متداول اسلامي

عضو مميز
التسجيل
7 أكتوبر 2005
المشاركات
2,099
الإقامة
في الميتاستوك
يستاهل المتابعه والعوده الشارت لكم
 

الملفات المرفقه:

  • brlc target.jpg
    brlc target.jpg
    الحجم: 82.9 KB   المشاهدات: 112

al7bebe

عضو نشط
التسجيل
24 مارس 2005
المشاركات
10,052

متداول اسلامي

عضو مميز
التسجيل
7 أكتوبر 2005
المشاركات
2,099
الإقامة
في الميتاستوك
TradingMarkets.com
Four Bearish Bets for Traders
Wednesday January 2, 3:33 pm ET
By TradingMarkets Research


Four stocks + 5 or More Consecutive Up Days = Opportunities to the short-side for traders.
If there is one of our TradingMarkets Stock Indicators that I like as much as the RSI indicator, then that indicator have to do with out research into five or more consecutive up or down days. Our research, published a few years ago in Larry Connor's book, How Markets Really Work, and updated recently in an article for TradingMarkets.com, warns traders that, in the short-term, markets making consecutive up or down days may not be as strong -- or weak -- as they appear.

ADVERTISEMENT


In general, our research found that there is a short-term edge in buying stocks when the market has declined for two or more days in a row compared to a market that has risen for two or more days in a row. The average one week returns in both the S&P 500 and the Nasdaq 100 were higher AFTER the S&P 500 and Nasdaq 100 were down multiple days in a row. Further the results showed greater one-week performance when the markets were down three days in a row compared to when they were down only one day in a row.

Since How Markets Really Work was published, this research into consecutive up and down days has been expanded, with part of that expansion including a review of individual stocks as well as the markets in which those stocks trade. This research paved the way for our TradingMarkets Stock Indicator which looks to buy stocks that have experienced 5 or more consecutive down days and to sell stocks that have experienced 5 or more consecutive up days. The only caveat is that, as always is the case when talking about short-term trading, we only buy stocks trading above their 200-day moving average and only look to sell stocks when they are trading below their 200-day moving average.

Each of the following stocks fits the above two criteria: each has advanced at least five days in a row, and all are trading below their 200-day moving averages. As I write, CBS is being upgraded from a PowerRating of 3 to a PowerRating of 4 intraday.

Syntax-Brillian Corp (NasdaqGM:BRLC - News). PowerRating (for Traders): 2

MacQuarie Global Infrastructure Total Return Fund (NYSE:MGU - News). PowerRating (for Traders): 3

Odyssey Healthcare (NasdaqGS:ODSY - News). PowerRating (for Traders): 3

CBS Corp. Class B (NYSE:CBS - News). PowerRating (for Traders): 3

Traders are never more bullish when a stock has advanced by five or more days in a row. And traders are never more bearish when a stock has fallen by five or more days in a row. Many times, these sentiments are sensible. But when a strong stock--a stock trading above its 200-day moving average--shows weakness, traders should look to become more, not less, risk-seeking and confident in buying that weakness. And when a weak stock--a stock trading below its 200-day moving average--shows strength, it is time for traders to show caution, rather than exuberance.

David Penn is Senior Editor at TradingMarkets.com
 
أعلى